Understanding and Measuring Residual Sugars
Alcoholic fermentation is the conversion of sugars, specifically glucose and fructose, into ethanol (and CO2 gas) by yeast. When these fermentable sugars are completely metabolized to a sufficiently low level, wine is considered stable and at essentially no risk of refermenting. Wine with greater amounts of residual fermentable sugars must be stabilized using sorbate in conjunction with sulfite or by sterile filtration.
But what is that “sufficiently low level” and how is it measured?
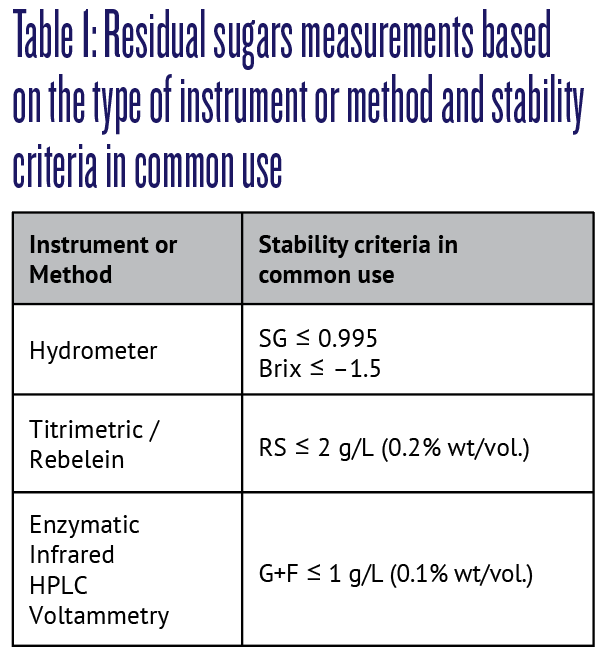
There are three de facto practices based on the type of test instrumentation available and the winemaker’s analytical expertise. At the most basic level, winemakers consider wine to be stable and protected against refermentation when specific gravity (SG) is equal to or less than 0.995 or Brix is equal to or less than –1.5 as measured with a hydrometer.
Those with the means and know-how to measure residual sugars (RS) consider wine to be stable and protected when RS is less than 2 g/L, or less than 1 g/L for those wanting greater assurance, while some winemakers (e.g., in Australia) use a much stricter threshold of 0.2 g/L.

And those with access to more advanced instrumentation, or if calling upon the services of a certified lab, consider wine to be stable and protected when the sum of glucose (G) and fructose (F), or what is termed G+F, is less than 1 g/L. Confusion arises when winemakers, or even labs, refer to G+F as RS, or vice versa; these are not necessarily the same.
To clarify this confusion and make sense of residual sugars and wine stability, this article reviews the different kinds of sugars found in grapes and wine, what “residual sugars” means in the context of microbial stability, and how sugars are analyzed and measured to assess stability. But sugar analysis is anything but straightforward. An analysis of homemade wines demonstrates this complexity — that there can still be significant amounts of fermentable sugars, even below those levels measured with a hydrometer, therefore putting the wine at risk of microbial activity if not stabilized properly. The analysis recommends a reliable method to confidently assess stability and refermentation risk.
Understanding Sugars
Glucose and fructose are the most significant sugars (saccharides) in winemaking. These are monosaccharides, meaning they are a single sugar unit, unlike sucrose (table sugar), a disaccharide that can be broken down into its two fermentable monosaccharides, glucose and fructose. These are also referred to as hexoses because of their 6-carbon molecular structure, and have identical molecular formulas but different molecular structures that we perceive differently; for example, fructose is much sweeter. Glucose and fructose exist in approximately equal proportions in wine grapes although it can vary by variety, viticultural practices, and vintage (climate). The total amount of glucose and fructose in grapes is in the range of 200–250 g/L for typical wines in the 11.5–14.5% ABV range. There may also be a very small amount of sucrose in grapes, but which is hydrolyzed into glucose and fructose by naturally occurring invertase enzymes that break the glucose–fructose bond during fermentation.
Saccharomyces cerevisiae yeast strains are glucophilic microorganisms, which means that yeast preferentially ferments glucose (G) over fructose (F), particularly when sugars drop below 1.080 SG or 20 °Brix. It would be expected then that this results in a G:F ratio of less than one in wine, typically in the range 0.1–0.5.1 And since fructose is much sweeter, if the same wine is fermented separately in two batches and complete with the same amount of residual sugars but with different G:F ratios, the one with more fructose (lower G:F) will typically taste sweeter.
Grapes and wine also contain non-fermentable sugars that yeast is unable to metabolize; these include: Rhamnose (another hexose); some pentoses, i.e., those with a 5-carbon structure such as arabinose and ribose, and which can exist in concentrations of up to 2 g/L2; and cellobiose, a disaccharide.

Those saccharides that can facilitate the reduction (the opposite of oxidation) of other substances are said to be “reducing sugars.” Sucrose is a non-reducing sugar as it cannot act as a reducing agent unless it is first broken down, or hydrolyzed, into glucose and fructose. We’ll soon see the importance of this distinction.
Figure 1 illustrates sugar groupings and the terminology used in wine analysis to describe fermentable and non-fermentable sugars, and residual and reducing and non-reducing sugars.
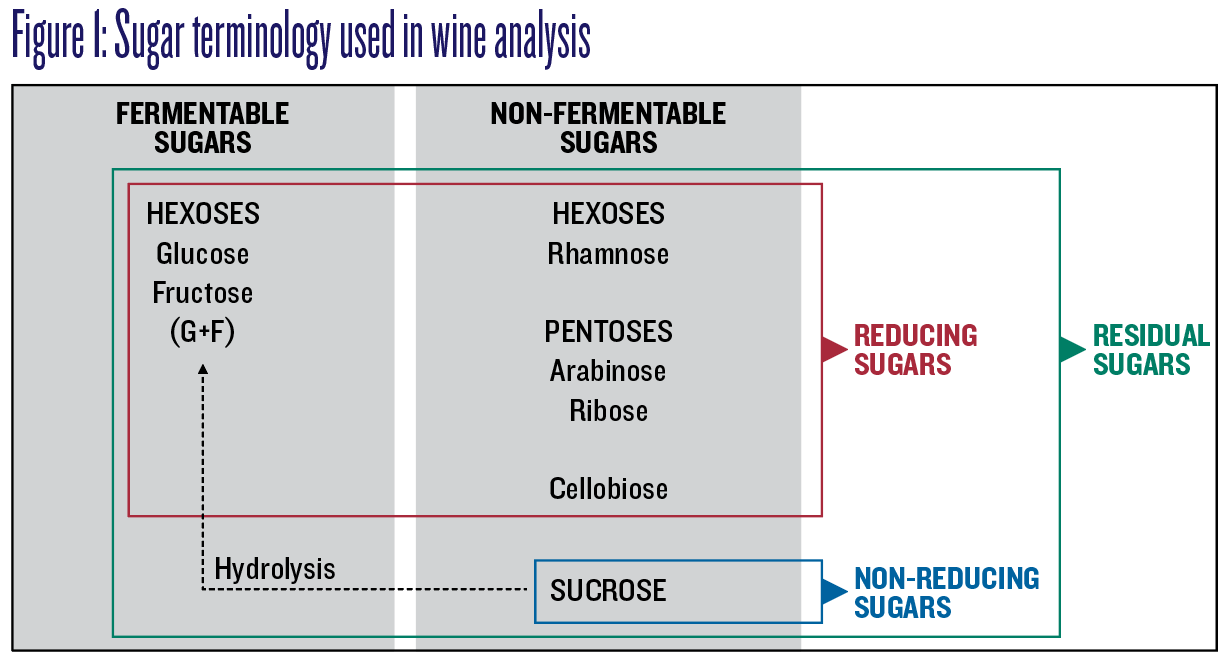
Generally, “reducing sugars” and “residual sugars” are interchangeable unless, for example, wine has been sweetened with a non-reducing sugar, such as sucrose, in which case residual sugars measurements will be greater than reducing sugars measurements. Since some analytical tools only measure reducing sugars, the amount of residual sugars can be significantly higher than measured. Unless a distinction is required, residual and reducing sugars are equivalent here and abbreviated to RS.
Coming back to the different practices used, if only measuring reducing sugars and knowing that no sucrose has been added, wine is considered relatively safe under 2 g/L, as it is assumed that at least 1 g/L is due to non-fermentable reducing sugars, therefore assumedly leaving less than 1 g/L G+F; the generally accepted safe threshold.
Measuring Residual/Reducing Sugars (RS)
Residual/reducing sugars and G+F quantities are expressed in g/L or as % weight/volume, for example, 2 g/L, which is the same as 0.2% wt/vol. To assess microbial stability, RS or G+F should be measured, at a minimum, at the end of fermentation and just before bottling.
Instruments and methods available to home winemakers for measuring RS and G+F range greatly in sophistication, reliability, and cost. And, of course, you can call upon the services of a certified lab. Table 1 summarizes instruments and methods and criteria variously used by winemakers to assess microbial stability.
The standard hydrometer is the most common and simplest tool. However, hydrometers, and especially the inexpensive kinds used by hobbyists, have an error of +/–0.002 SG and are therefore not appropriate for quantifying RS as they are too inaccurate, particularly in the presence of alcohol and more so below SG 1.000 or 0 °Brix; the presence of dissolved gases too, primarily CO2, will skew hydrometer measurements. There are better hydrometers that can measure density with greater accuracy (+/–0.001 SG), but these too are not adequate as there can still be significant fermentable sugars, even below generally accepted threshold levels shown in Table 1.
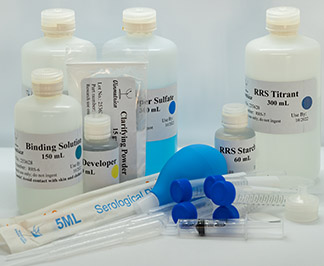
RS can be measured more reliably using titrimetric methods. The Rebelein titrimetric method, also known as the Gold Coast method, is commonly used as it can be performed quickly and inexpensively without the use of sophisticated equipment. There are many variations of the Rebelein Method; Vinmetrica’s Residual/Reducing Sugar Assay Kit (pictured below) is one example. A comparison of the various methods and apparatus for measuring RS can be found in the References at the end of this article, along with a link.3
The Rebelein Method consists of causing reducing sugars in a wine sample to react with copper under alkaline conditions. Potassium iodide and sulfuric acid are then added to reduce excess copper to produce an equivalent amount of iodine, which is then titrated with sodium thiosulfate.4 The amounts of titrant dispensed to titrate a wine sample and a “blank” (water, used as a reference) are used to calculate RS. Red wines must first be decolorized using activated charcoal or PVPP (polyvinylpolypyrrolidone) to eliminate interference from anthocyanins (color pigment molecules) as these too are reducing agents. Ascorbic acid is another reducing agent that interferes with the analysis, and therefore, measurements should be performed before any ascorbic acid addition. And if sucrose was added to sweeten wine, samples must first be treated by acid hydrolysis to break down sucrose.
There are other inexpensive, quick methods and apparatus though these tend to be less accurate. These include: Clinitest tablets, used for glucose analysis in urine; the Fermentest® kit, a complete kit developed by Laboratoires Dujardin-Salleron specifically designed for wine analysis and which also includes paraphernalia to treat red samples; and Accuvin QUICK TESTS Residual Sugar strips. All these rely on a color change that is matched to a chart to determine RS.
Clinitest tablets and reagent tablets in the Fermentest® kit contain copper sulfate and alkaline salts, which are made to react with wine samples. The mixture generates a temperature rise that causes the characteristic reaction of reducing sugars. The result is obtained by observing the color change with the excess of blue copper salts and/or red copper oxide formed. These tablets can measure RS up to 5 g/L without dilution; samples with greater amounts can be diluted as required.
Accuvin test strips are simply dipped into wine samples to measure RS. These are based on the change in color exhibited by a special indicator during a reaction involving hydrogen peroxide in the presence of the enzymes peroxidase and glucose oxidase. These strips can measure RS up to 2 g/L without dilution; samples with greater amounts can be diluted as required.
These methods provide relatively good estimates of the amount of residual sugars, but they cannot measure the amounts of residual glucose and fructose to confidently assess refermentation risk. Glucose and fructose can be measured discriminately using more sophisticated enzymatic–spectroscopic, infrared (IF), or HPLC (high-performance liquid chromatography) techniques used in commercial laboratories, or using voltammetry-based devices, such as the Sentia Analyzer, which can measure both in a matter of minutes — it cannot measure sucrose.
Comparing Analytical Methods
The following is an analysis of SG/Brix and RS data for 41 homemade white, rosé, and red wines collected over eight vintages, and also G+F for 14 of those wines. All wines were deemed to have fermented completely dry after a stable hydrometer reading for two consecutive days.
For simplicity, only SG values are shown for density. SG was measured using a high-accuracy hydrometer and adjusted for temperature. RS was measured using Vinmetrica’s Residual/Reducing Sugar Assay Kit and all samples were treated with PVPP to remove interfering non-reducing substances, i.e., anthocyanins in reds. G+F was measured using a Sentia Analyzer. RS and G+F are reported in g/L.
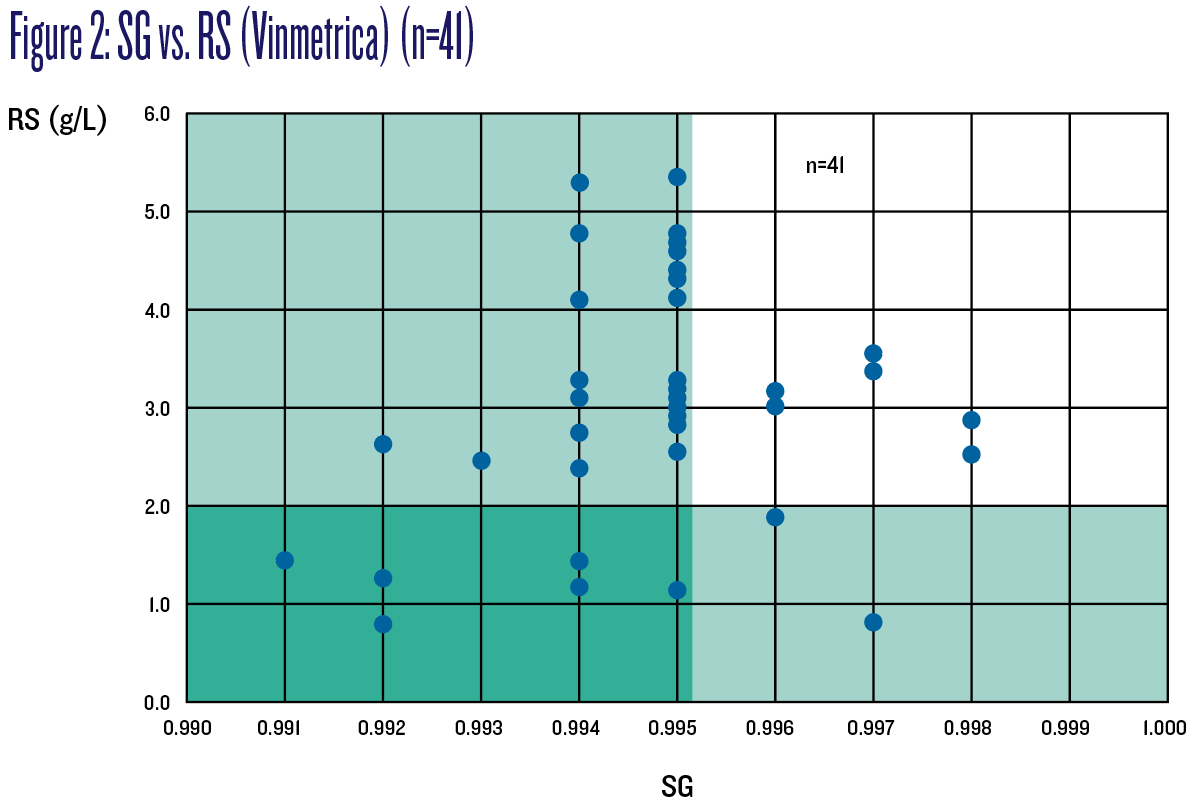
Figure 2 charts SG vs. RS for all 41 wines. Those wines in the green-shaded “safe zones” have SG equal to or below 0.995 or RS equal to or below 2 g/L. The chart demonstrates two very different sets of wines that would be considered stable and at no risk of refermentation depending on which criterion is applied. The overlap set in the darker-green zone are those wines that meet both criteria.
Based on this data, it can be concluded there are still appreciable amounts of residual sugars (RS >2 g/L) in many wines (26/40) with a final SG equal to or below 0.995, and which would therefore still be considered unstable and at risk of refermenting. Perhaps surprisingly — and this proves the unreliability of hydrometers — some wines with higher final SG have lower RS, two of those less than 2 g/L and which would therefore be considered more stable and at less risk of refermenting. This demonstrates that hydrometer readings at dryness cannot guarantee stability one way or another.
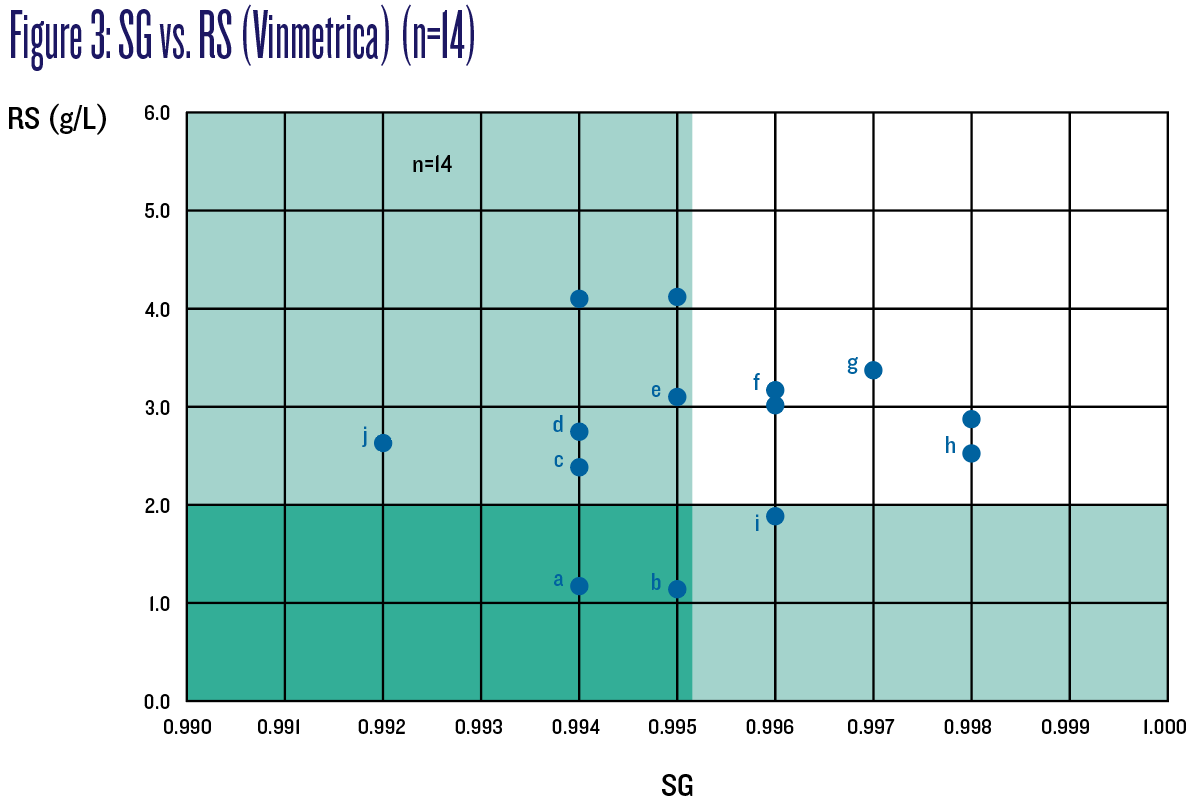
Figure 3 is the same chart as Figure 2, but showing only 14 of those 41 wines for which G+F was measured and collected too. Out of those 14, 10 wines (labeled “a” through “j”) are of interest now as these measured less than the stricter criterion of 1 g/L G+F.
Of the lettered wines (those with G+F ≤1 g/L; wine “b” is included here although it measured 1.09 g/L, close to 1 g/L when instrumentation error is factored in) and based on SG measurements, wines f, g, h, and i would not have been deemed “no risk” of refermenting as they measured above 0.995. Similarly, based on RS measurements, wines c, d, e and j too would not have been deemed “no risk” as they measured above 2 g/L. Figure 4 charts SG vs. G+F to better illustrate these results; the safe zone is shaded green.
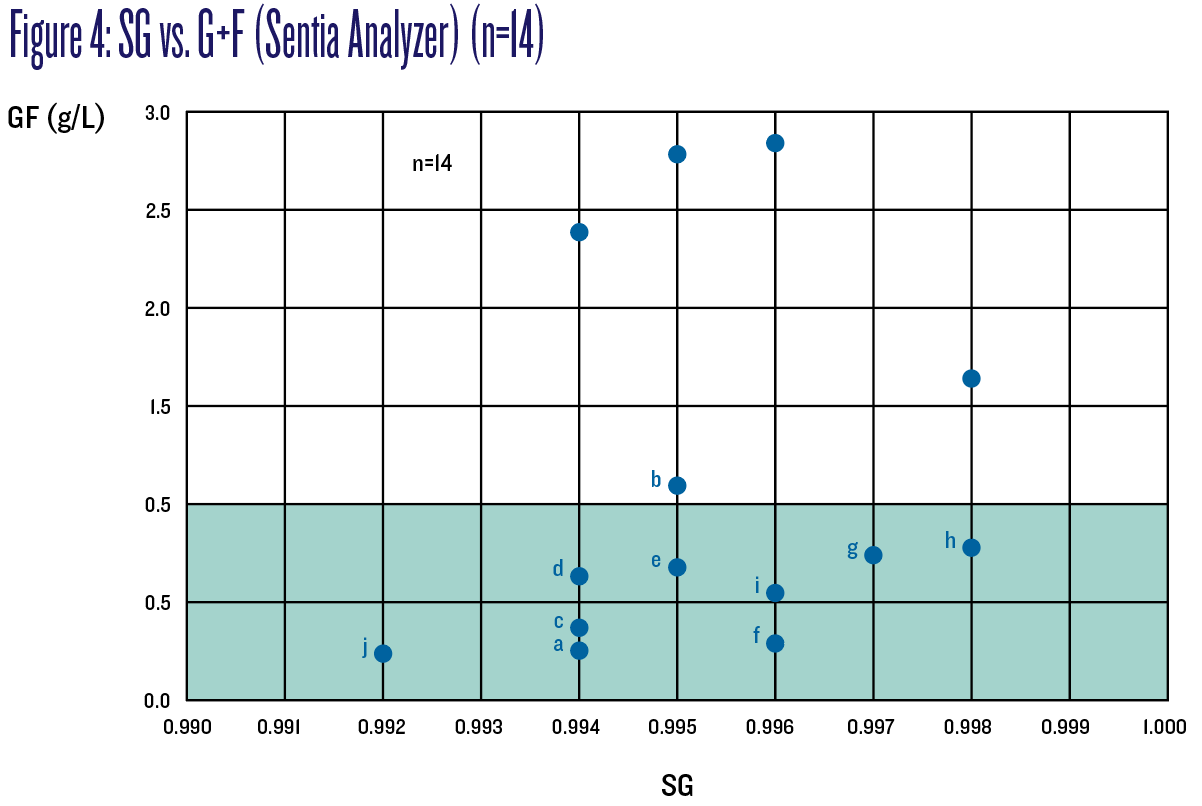
Figure 5 charts RS vs. G+F for those same 14 wines along with the difference in red font between RS and G+F measurements for those 10 lettered wines that measured G+F ≤1 g/L; for example, wine d measured 2.58 g/L RS with Vinmetrica’s kit and 0.63 g/L G+F with a Sentia Analyzer, and therefore a difference of approximately +2.0, likely due to non-fermentable sugars. The difference increases with increasing RS, suggesting that higher RS measurements imply higher amounts of non-fermentable sugars. Usually, non-fermentable, non-reducing sugars are expected to be in the range 1–2 g/L; this analysis of a small sample set shows that it can be up to 3 g/L.

Unless you will be doing a lot of RS analysis and decide to invest in a Sentia Analyzer, RS measurements using Vinmetrica’s Residual/Reducing Sugar Assay Kit can be used and interpreted to assess refermentation risk.
For those wines that measured less than 4 g/L RS using the Vinmetrica method, subtract an approximate difference due to non-fermentable sugars to obtain an estimated G+F, and if the difference is under 1 g/L, the wine can be assumed with high confidence to be at no risk of refermenting. For example, if a wine measures 1.5 g/L RS (similar to wine a), subtract 1.0 to obtain 0.5 g/L G+F, or if a wine measures 3.0 g/L RS (similar to wines e, f, and g), subtract 2.5 to obtain 0.5 g/L G+F.
This method shows that wines with up to 3.5 g/L RS as measured using the Vinmetrica kit can be considered stable and a low risk of refermentation. Those wines with RS <2 g/L can be considered stable with even greater confidence.
Interestingly, only 6 of the 14 wines analyzed had lower G than F, and therefore, it can be concluded that different yeast strains metabolize glucose and fructose differently, and that residual sugars do not necessarily contain greater amounts of fructose compared to glucose. Those wines with high G+F (above 2 g/L) measured significantly larger amounts of glucose compared to fructose (e.g., 2.34 vs. 0.43 g/L). And no wine measured less than 0.2 g/L; four were close measuring in the range 0.22–0.34 g/L.
Ensuring Microbial Stability
When G+F is greater than 1 g/L or RS is greater than 2 g/L, or if those cannot be measured, if a hydrometer reading is greater than 0.995 SG or -1.5 °Brix, wine is best stabilized against the risk of renewed fermentation. The two options are sorbic acid or sterile filtration. Sulfur dioxide (SO2) on its own is not sufficient, not if wine is to be aged and at low free SO2 levels; as free SO2 slowly dwindles over time, any yeast still present can become active and start metabolizing any remaining fermentable sugars.
Sterile filtration involves first successively filtering wine with pads or cartridges down to 0.45 µm (micron) followed by a final sterile filtration right into bottles at absolute-rated 0.45 µm to remove latent yeast. Unless bottling is done under “sterile” conditions, as defined in winemaking, the wine will still be at risk of microbial activity, but which can be managed using SO2 judiciously based on pH.
When sterile filtration is not possible, sorbic acid can be used to inhibit yeast and protect against renewed fermentation, but it requires SO2 to be effective. Since sorbic acid has poor solubility in wine, it is added in its salt form as potassium sorbate (“sorbate”), which has better solubility. However, it should not be used in wines that have undergone malolactic fermentation (MLF) unless lactic acid bacteria have been removed by sterile filtration down to 0.2 µm. Lactic acid bacteria can otherwise metabolize sorbic acid into sorbyl alcohol, which can react with ethanol and produce 2-ethoxyhexa-3,5-diene, a compound that imparts a strong and disagreeable odor of rotting geraniums, detectable at approximately 0.1 μg/L or 0.1 part per billion (ppb).5
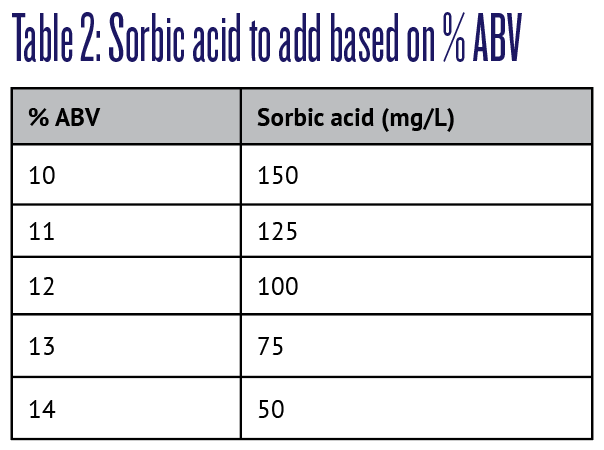
For wines with pH up to 3.5, add sorbate at a rate of 1.34 times the amount of sorbic acid needed based on ethanol level (% ABV) as per Table 2. For wines with pH greater than 3.5, use the next higher dosage as the amount of molecular sorbic acid (the active form) available drops from about 95% to 85% at pH 4.0. For example, a wine with 5 g/L RS, 12% ABV, and pH 3.75 would require 125 mg/L of sorbic acid, or 167.5 mg/L of sorbate.
Be sure to add sulfite based on pH according to WineMaker’s Sulfite Calculator (www.winemakermag.com/sulfitecalculator); sorbate on its own is not sufficient to inhibit yeast. If sweetening wine with sugar, add sorbate and sulfite first.
References:
1 Taillandier, P. and J. Bonnet. 2005. Le vin: Composition et transformations chimiques. Éditions Tec & Doc – Lavoisier.
2 Moreno, J. and R. Peinado. 2012. Enological Chemistry. Academic Press.
3 Pambianchi D. 2019. A Comparison of Various Methods and Apparatus Available on the Market for Measuring Reducing Sugars in Wine. https://shorturl.at/WORfG
4 Zoecklein BW, et al. Wine Analysis and Production. Aspen Publishers.
5 Bertrand A, Blaise A. 1998. Altérations organoleptiques des vins. Oenologie: Fondements scientifiques et technologiques. C Flanzy (ed.), pp. 1183–1216. Tec & Doc – Lavoisier.