Experimenting With Deficit Irrigation
As winemakers we all strive to improve the quality of our wines. It’s often said that wine quality begins in the vineyard, so that’s our focus today. Years of drought conditions across California have sparked thoughts about using less water. Deficit irrigation does just that. This is a familiar concept to many commercial winegrowers, but it is also something that can be implemented in your own backyard vineyard. Less water can stress the vines and at the same time produce higher-quality grapes — higher quality by virtue of more intense flavors and aromas. The yield will be impacted, however. As home viticulturists and winemakers, we are willing to take a yield hit to hopefully learn more about deficit irrigation, save some precious water, and make better wine. It is getting more challenging and expensive to grow winegrapes in what is becoming the new normal of more frequent drought years. Well, just maybe we can still grow high-quality grapes.
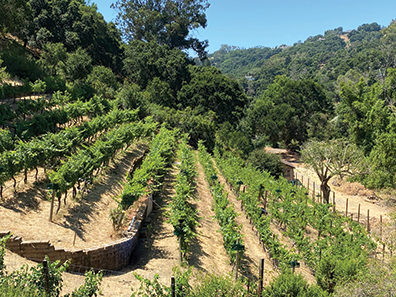
We are enthusiastic home winemakers and perhaps “over the top” backyard grape growers. We wanted to follow a deficit irrigation experiment all the way from the vineyard to finished wine in the glass, so over the following pages we will explain our experiment that you can implement too.
The joy of making a high-quality glass of wine is something very special. The fun of tasting and sharing quality wine with family and friends takes it to another level.
This experiment was made easier by virtue of having two different varieties — Merlot and Cabernet Sauvignon — and four different watering stations, arranged such that we could have a control batch and a deficit batch for each. We chose an irrigation approach that kept the vines well watered at the beginning of the season when there is a lot of plant growth and then, after veraison (when the grapes begin to change color), we applied a harsh water deficit to certain blocks. We used soil moisture sensors to monitor water in the ground throughout the experiment. We then set deficit levels by fractions of full crop evapotranspiration (ETc).

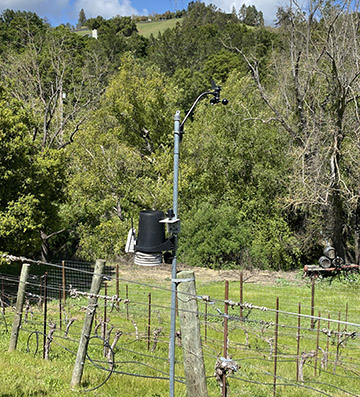
Growing grapes in the Santa Cruz Mountains AVA in California, we were fortunate to have access to an online vine water use indicator known as evapotranspiration (ET). It is the amount of water that a crop uses plus how much evaporates. This ET source was the California Irrigation Management Information System (CIMIS). There are other systems, like the Davis weather station shown to the right, or other larger more sophisticated commercial systems that also produce estimates of ET. We chose to compare water levels to ET; however, there are other valid ways to run deficit irrigation experiments in one’s vineyard. These include simply changing the frequency of watering intervals between different vines. It is still advisable to retain reasonably long watering sessions to let the water drain into the soil and get down to the deep roots. For example, one could irrigate one block for one hour twice a week and another one hour once per week.
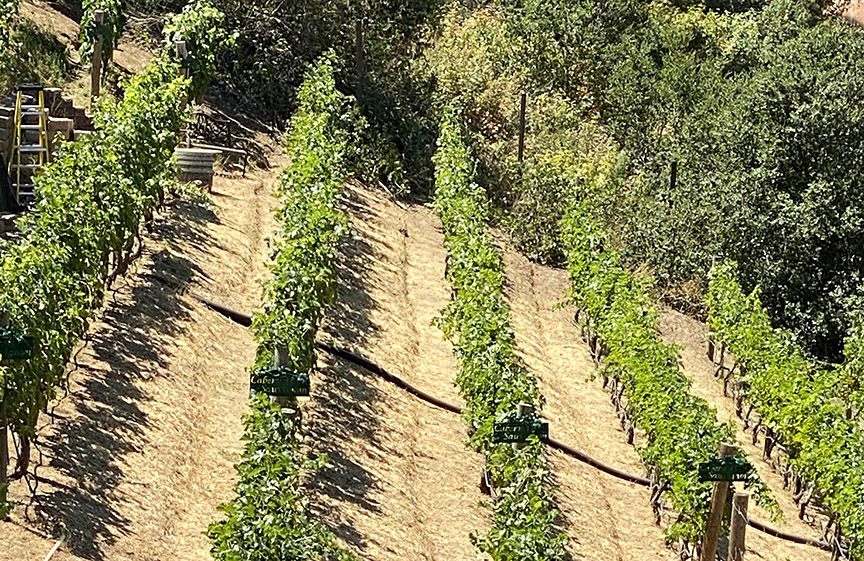
This gave us a reference value and by also measuring the size of our vines through shadow assessments, we could establish our vineyard water use in inches per day (crop evapotranspiration or ETc). As the vines and vineyard canopies grow bigger, they need more water to stay healthy. Williams and Ayers1 came up with a brilliant way to estimate the size using the shadow of the vine itself. They showed the size of the shadow was linearly related to how much water the vine would use. This scale factor is called the crop coefficient (Kc). Looking at the shadow size and its fraction of the separation between vine rows, as shown in the picture below, gives a percent value that allows this calculation. This can be tracked and used to estimate total vine water use and determine what smaller fraction you may want for your deficit level.
By measuring the rainfall, we could determine how much to irrigate to support vineyard water needs or wants. We were trying something new for our vineyard, so we went for a big difference of four times the water for high irrigation vines compared to deficit irrigation levels. We hoped a large 4x factor difference in the amount of water would result in a big difference in grape and wine characteristics.
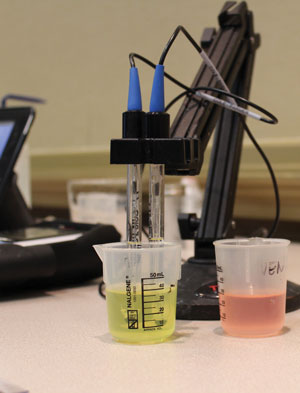
Frequent walks, observations, and tests provided us information on how the study was progressing. We chose to test sugar, titratable acidity (TA), and pH to determine when to harvest. After harvest, we also measured yields for each block (normalizing it on a per-vine basis) and berry size distributions to see whether there was a measurable difference. Chemistry is a big part of the story, but we were even more interested in how the finished wine would taste. We set up a sensory evaluation final step using the UC-Davis 20-point scale. The blind tasting helped us identify true differences between control and deficit blocks without biases.
Yield, Berry Size, and Chemistry Results
Just as expected, the relative yield dropped (about 40% for the Merlot and about 10% for the Cabernet Sauvignon) for blocks with the harsher deficits (these values will vary considerably from vineyard-to-vineyard). This is what commercial grape growers have known for years. Commercial growers need to worry about the balance between less yield, less tonnage, and less income vs. higher quality and possibly higher price per ton. It is a tough commercial choice to pick a method that will drop one’s yield.

It was also notable to see that the berry diameters shrank for both varieties. Berry size reduction is also an indicator of deficit irrigation. This gave us further confidence that we were achieving water deficit effects in the less watered blocks. The smaller berries may also indicate a possible increase in concentration of flavor and aroma compounds.2 This means that if a grape is smaller because of less water, while the flavor and aroma compounds are the same, the concentration of these compounds will be higher. At this point in the experiment, we were getting more excited about the possibility of more intense flavors and aromas in the finished wines.
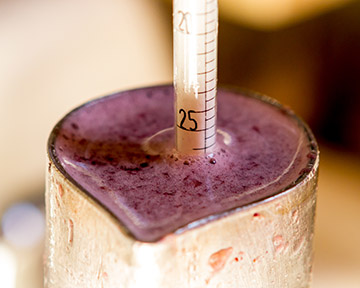
The sugar concentration was 24 °Brix for the deficit Cabernet Sauvignon grapes vs. 23 for the control block. The Merlot sugar was 25 °Brix for the deficit block vs. 23 °Brix for the normally watered grapes.
Winemaking Method
We used the same winemaking method for each of the two varietals. The yeast was different for the Merlot and Cabernet Sauvignon. We were not trying to compare Merlot vs. Cabernet Sauvignon; we were making wine with good standard practice for each variety and comparing deficit irrigation levels. The grape clusters were crushed with a destemmer-crusher that would break the skins and separate the stems. We used fermentation tanks in a temperature-controlled winery room. We made measurements of the pH and titratable acidity to make sure that we were in the acceptable ranges of pH between 3.4–3.8 and acid between 6–8 g/L. We measured the pH and added 50 ppm potassium metabisulfite prior to fermentation.
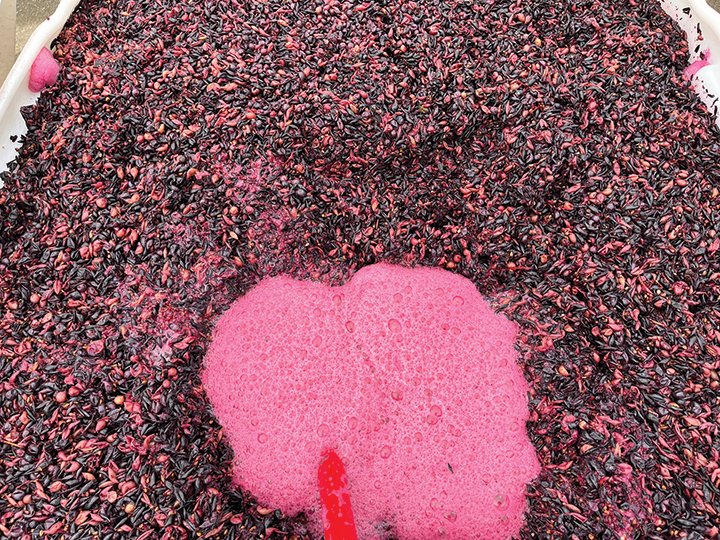
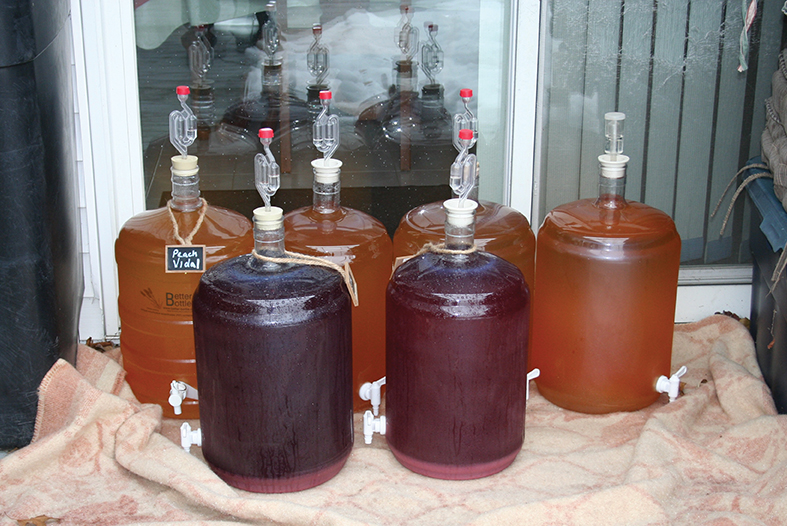
For the Cabernet we inoculated with BM4x4 yeast and added Fermaid K yeast nutrient to start primary fermentation. For the Merlot wines we used RP15 as the primary fermentation yeast and added Fermaid K. We punched the cap down four times per day and monitored the temperature and sugar. When the sugar got below 16 oBrix, we added a second dose of Fermaid K. The primary fermentation lasted approximately eight days with peak temperatures for both of the Cabernet blocks reaching up to 81 °F (27 °C) and for both of the Merlot blocks getting as high as 85 °F (29 °C). We pressed both varieties at approximately 0 °Brix with a hydraulic press. After fermentation, the wines were moved into stainless tanks. A week later, we performed the first racking and initiated malolactic fermentation using Viniflora Oenos cultures. The wine sensory evaluation occurred after three months in stainless tanks. The key to this comparison was to use the same standard process for the different irrigation blocks.
Finished (Young) Wine Results
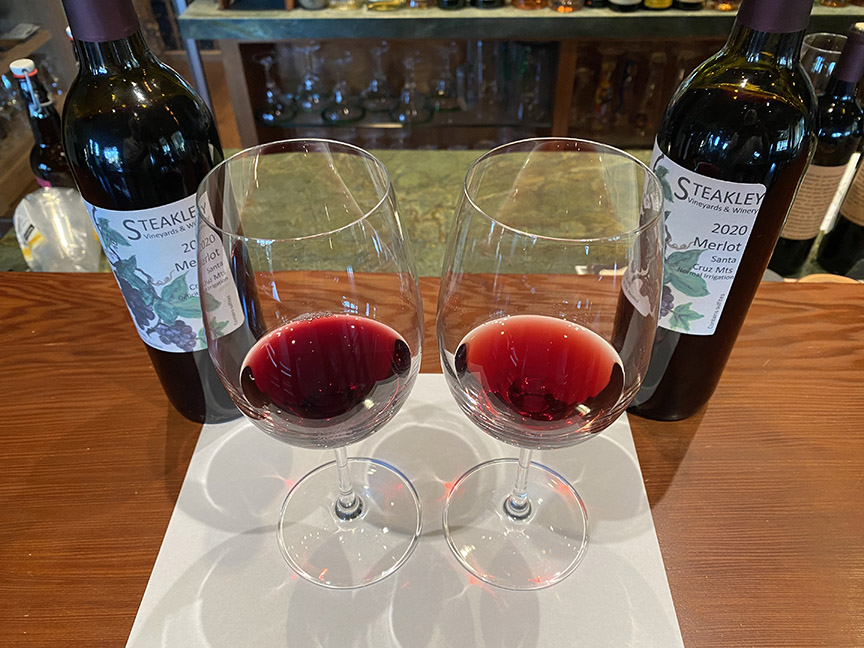
Now on to the fun phase of tasting! We made four different wines in the same way; two different varietals each with two different irrigation levels. We utilized a tailored approach to taste and evaluate the wines. The tasting was blind to the two of us (a third party secretly poured the anonymous wines). This would help give us confidence in truly discerning the differences between wine made from our normal and deficit watered grapes. We tried to avoid biases in what “we hoped for” and truly compared the wines from different irrigation blocks. This was one of the most fun parts of this trial. We finally got to taste the wine! It is widely believed that deficit irrigation can produce better wine. Now we were about to find out for ourselves if this is true for our vineyard.
The first part was intended to see if we simply could tell the difference between the two wines. We used a triangle test consisting of three wine glasses, with two that are the same wine and a third with a different wine. Then we evaluated the wine with our own tailored version of the Davis 20-point scoring system and its 10 different categories: Clarity, color, aroma, acidity, sweetness, taste, texture, astringency, finish, and overall complexity. The Davis scoring system was a brilliant approach originally developed by Maynard Amerine for categorizing the massive wine collection at UC-Davis.3 It has subsequently been used; with a few modifications, twists, and turns, by many home winemaking competitions for blind tastings and evaluating homemade wines.
The results are in and both of us were able see more intense colors, smell more intense aromas, and taste more intense flavors in the wines from the deficit irrigated grapes. Both of us were able to discern which wine was different and which wine was the same in the blind triangle test. We even independently correctly identified which wine was the deficit wine by virtue of its darker color and more intense aromas
and flavors.
The deficit-irrigated Merlot received an integrated score of 18.5 and the normal-irrigated Merlot scored 13.5 on the Davis 20-point scale. The difference between the two wines is very pronounced. The deficit Cabernet Sauvignon received an integrated score of 19 and the higher watered a 17. Color, aroma, taste, and overall complexity categories showed better for the less watered wines. These wines were not aged with the intention of avoiding oak or aging effect. The wine was only three months old with the expectation of more fruity characteristics. We tasted more intense blackberries in the deficit Cabernet and more red fruit in the deficit Merlot.
Digging a little further into the results, we gave the normal irrigation Merlot aroma intensity level a score of moderate (2 of 3) with notes of red fruit, whereas the deficit Merlot received a powerful (3 of 3) with notes of red and black fruit. The Cabernet received a score of 3 in the aroma evaluation with notes of black fruit but so did the normally irrigated Cab wine. However, for the deficit Cab, I assessed more intense notes of ripe and jammy fruit. Not a 100% clean sweep, but equal or better was the result where the deficit was always equal to or had more intense positive characteristics than in the normally irrigated wines.
Our overall comment about greater intensity in the deficit wines is a rough integration of all the relative assessments showing greater intensity in red or ruby color, black and or red fruit sensed in the nose or tasted in the palate. We did not sense much difference in the tannin, acid, alcohol, body, or balance attributes. We both sensed greater texture in the deficit wines. It was remarkable to have this many ways to evaluate a wine and both of us, independently from one another, consistently show equal or better “tasting” qualities in the deficit wines.
Looking Forward
So what’s ahead for our home vineyard based on this experiment? The results have inspired us to investigate further. Life intervened and interrupted vineyard experiments in 2021; however, we got back to work in 2022 with yet another more robust deficit irrigation experiment that is still in progress. We backed off on the net watering even further in 2022 and again in 2023. We’re still focusing on irrigation, but only on Cabernet Sauvignon, our premier crop. We are convinced that deficit irrigation decreases yield but increases quality. The open question for our vineyard is more toward discovering what precise deficit irrigation level produces the best grapes and best wine. In addition, we have a lingering question about year-to-year weather conditions and how much it influences results.
We like the “vines-to-wine” concept but don’t want too many different experimental wines running through our “behind the garage” winery at the same time (We think we’re already way over the norm on this front). We have four separate irrigation blocks in the vineyard. With only Cab in the experiment, we could run two pairs of separate controls (what we used to call normal irrigation) and test (deficit) blocks. This would allow us to replicate the experiment in the vineyard to give us a higher level of confidence. These blocks run east to west. We also want to explore the north south effects of our small canyon vineyard. We may have sunshade effects becoming a more significant factor. We are a hillside canyon vineyard with large trees uphill east of the vineyard and down hill west of the vineyard. This means we are taking eight different wines through our small winery to get to the final sensory evaluation!
Other recent changes include dropping the irrigation levels in both the control and test blocks. We suspect even less water will produce higher-quality grapes. We still want the high 4x difference between control and test blocks. This 4x in irrigation levels will give us a better chance of seeing a good output response in the grape and finished wine quality levels. In the spirit of mixing experimentation and fun, we are scheming on a get-together with other home winemakers and wine drinkers to go through a sensory training session and then evaluate the eight different wines and discover what we will. The larger number of tasters will also increase confidence in our sensory results and findings.
At the end of this, I think the question arises of whether the better quality wine is worth the loss in crop? We are home winemakers and don’t sell wine. We draft friends and family for the big events like harvest and bottling and offer a great ½ day in the vineyard or winery, lunch, and the promise of a couple bottles of nice wine in two years. We also donate some of the wine to various causes. We have also been making almost 40 to 50 cases a year and our inventory is going up! Our home winemaking storage room is in our air-conditioned winery (which is full) and our air-conditioned house (which is full of more wine than expected). These practical constraints have pointed us, in our unique situation, to appreciate the idea of making less wine, but of a higher quality.
There are qualities in deficit irrigation conditions that make more intense wine characteristics. Deficit irrigation effects are not new; however, we have been able to confirm effects and levels in our own vineyard. There is an optimal water level balance out there and it will vary between varieties, vineyards, and regions. Setting a part of your vineyard aside for some fun experimentation will reveal characteristics that may have been masked by other conditions. Whether your vineyard allows small, medium, or large blocks, you will still find good guidance on how to improve your own grape growing for higher-quality wines.
References:
1 Williams, L. E., & Ayars, J. E. (2005). Grapevine water use and crop coefficient are linear functions of the shaded area measured beneath the canopy. Agricultural and Forest Meteorology, Volume 132, Issues 3–4 (2005).
2 Casassa, L., Keller, M., & Harbertson, J. (2015). Regulated deficit irrigation alters anthocyanins, tannins and sensory properties of Cabernet Sauvignon grapes and wines. Molecules 20, 7820-7844.
3 Amerine, M., Roessler, E., & Fillipello, F. (1959). Modern sensory methods for evaluating wine. Hilgardia 28(18): 477-567.