Bench Trials and Tribulations
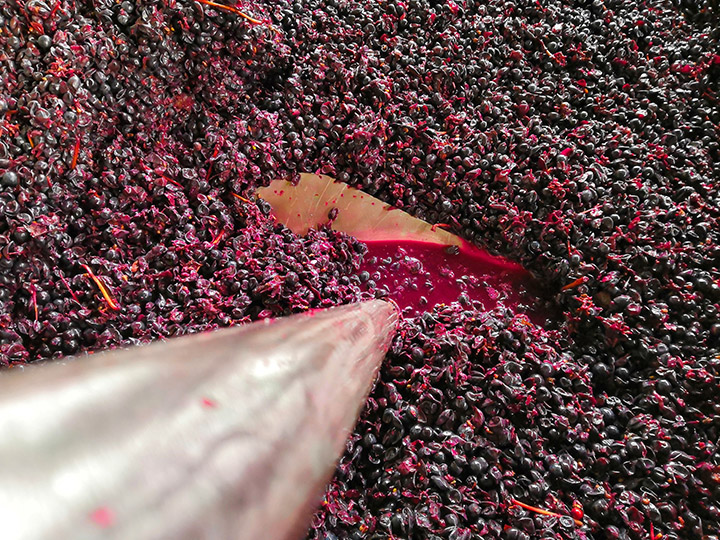
In late August, 2018, I picked 350 pounds (160 kg) of Sauvignon Blanc grapes from my favorite vineyard in the foothills of the Sierra Nevada in California. I had made very good Sauv Blanc from this vineyard three times previously. The grapes are always fully ripe with good acid and wonderful flavors. This time was different. The Brix was OK at 22, maybe a bit lower than usual, the pH was 3.2, also a bit low, and the titratable acidity (TA) was 10 g/L or 1 g/100 mL, a bit high. It’s OK, I told myself; it will straighten out through fermentation and with a bit of aging.
The fermentation proceeded smoothly. Two weeks later when I racked the wine off the lees, I rechecked the numbers. The TA was still 10, and the pH had dropped to 3.14. Ok, I told myself, just leave it alone, and recheck it in a few months. So I adjusted the free sulfite level to 45 ppm and cellared the wine at 60 °F (16 °C) in glass carboys. When I checked it the following April the pH had fallen to 3.08 and the TA was 8.4. The low pH made the wine taste very tart and unpleasant to drink. With 24 gallons (91 L) of wine in carboys, I needed to figure out what to do. The options were to fix it or dump it. With dumping not being an option I wanted to pursue, I began brainstorming ways to fix this wine.
In an effort to make it as good as it could be, I decided to try four treatments:
• Deacidify the wine using potassium carbonate
• Dilute the wine with water
• Blend the wine with a wine of higher pH
• Malolactic fermentation (MLF)

Conducting bench trials
The challenge is to determine the right amount of treatment to achieve the desired result. I used bench trials with graphical analysis of the trial results to guide the final adjustments. For acid adjustments, tracking the pH while incrementally making the adjustment and plotting the result can be used to interpolate the TA. This article provides examples of the graphic technique.
Bench trials are extremely useful when dealing with irreversible adjustments to your wine (ever try to unblend a wine?). The rules of thumb are not exact. Every wine will react to an adjustment differently. The common advice is to use the rules of thumb to calculate the addition then add half of the amount, wait, check the wine, and repeat. Plotting the results of the bench trial results makes it possible to dial in the exact addition required to achieve the intended results. See the final section of this web page for additional information on how to conduct a bench trial for acid adjustment.
The typical target range for white wine pH is 3.2–3.5, and TA is 6.0–9.0 g/L. The TA for this Sauv Blanc falls into the high end of this range, but the pH is well below. When adjusting the acidity of a wine, pH and TA are inversely related. The pH usually goes up when the TA goes down. Also, the flavor profile of the wine changes with the pH having a stronger effect on the perception of the wine. Low pH brings out the freshness and fruit character of the wine. As the pH increases, the wine gets rounder and softer, but less vibrant and may become flat or flabby.
In establishing a target for the finished wine, I chose pH of 3.2 and TA of 7.2 g/L, remembering the first rule of wine adjustments: Smaller adjustments are always better. Of course sensory evaluation of the wine is the most important criteria. Just “dialing in the numbers” will not guarantee a good wine. So the bench trials were conducted in two parts: First titrate in the adjustment while tracking the pH, then picking two or three representative levels of adjustments that approach the desired numbers, and reblending small samples of the wine to that parameter for tasting and TA analysis. So, on to the trials.
Trial 1: Potassium Carbonate
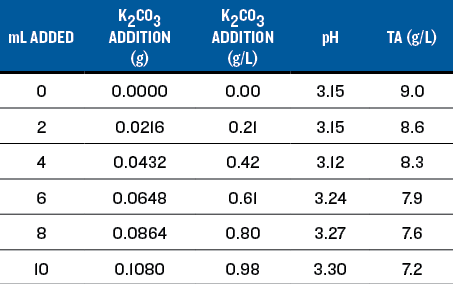
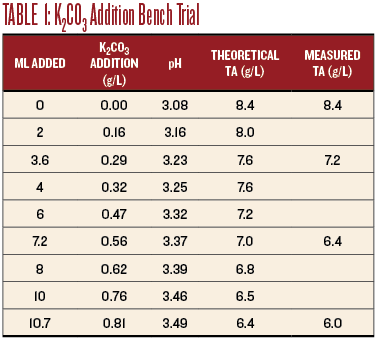
For reducing acid in wine, the rule of thumb is that 0.6 g/L of potassium carbonate (K2CO3) will reduce the TA by 1.0 g/L and raise the pH by approximately 0.25 units. For the titration, I prepared a solution that contained 0.0134 grams of K2CO3per mL of solution by dissolving 6.7 grams of K2CO3into 500 mL of wine, and filled a 20 mL syringe. Of the added K2CO3,2.52 grams was consumed to neutralize the acid in the solution, leaving 4.18 grams active to react with the wine.

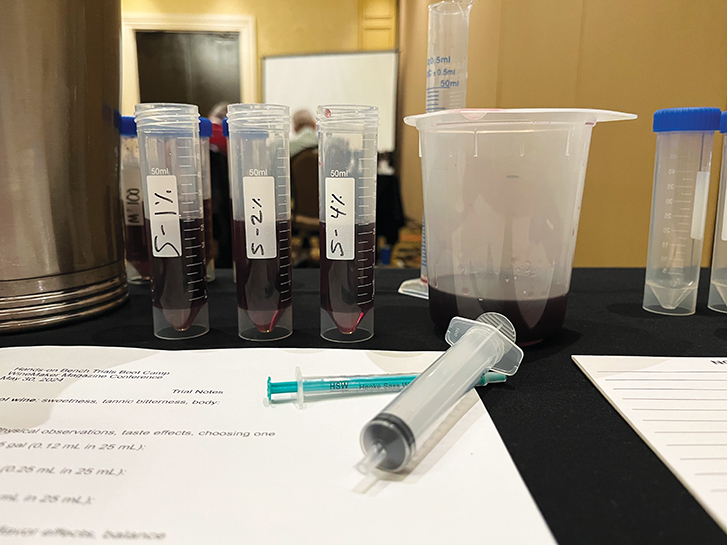
I measured 100 mL of the wine into a beaker and placed it on a magnetic stir plate. I calibrated the pH meter, placed the probe into the wine and recorded the pH. I added the K2CO3 solution in 2-mL increments and recorded the pH after each addition, allowing time for the reading to stabilize (see Table 1). The pH increased from 3.08 with no addition to 3.49 at 10.7 mL addition. I did not continue because the wine was well past the intended adjustment. Table 1 shows the effect on the pH and TA.
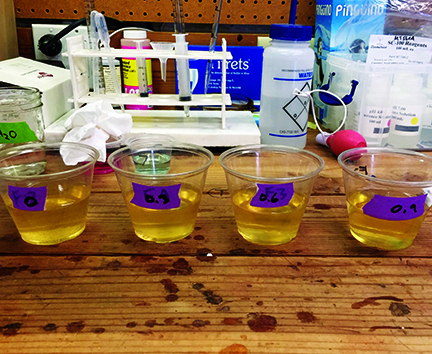
For sensory evaluation, I chose additions of 3.6 mL, 7.2 mL, and 10.7 mL to 100 mL samples of the wine. This corresponds to additions of 0.29 g/L, 0.56 g/L and 0.81 g/L K2CO3 (as shown in Table 1). The smallest addition tasted the best, the medium addition really dulled the wine, and the largest addition obliterated the Sauvignon Blanc character.
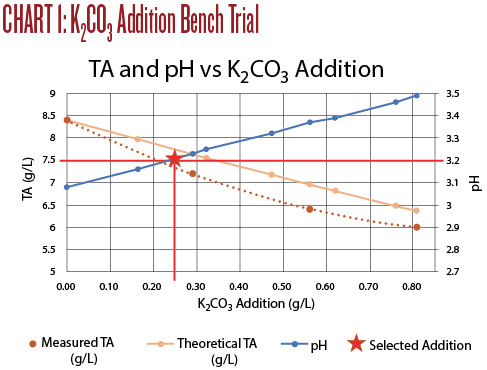
The titration results are shown on Chart 1, below. An addition of 0.25 g/L of K2CO3 increased the pH to 3.18 and the TA to 7.8, very close to the target values. I believe this resulted in the best sensory evaluation. At a wine club tasting, this adjustment was also the highest rated of all of the adjusted wines.
K2CO3 deacidification.
A few observations from Trial 1:
• Increase in pH is roughly proportional to the K2CO3addition. However, the rule of thumb addition of 0.60 g/L raised the pH 0.31 units instead of the expected 0.25 units.
• Decrease in TA is not linear. The rule of thumb addition of 0.60 g/L lowered the TA by about 2 g/L; twice the rule of thumb change of 1.0 g/L.
• Using K2CO3can be useful if the goal is to both reduce TA and increase pH. In this case a small addition brought TA and PH into the recommended range and improved the wine immensely. The treated wine was tart but balanced and enjoyable to drink. The Sauvignon Blanc character was enhanced with more fruit flavors as well as a much better mouthfeel.
Trial 2: Dilution with Water
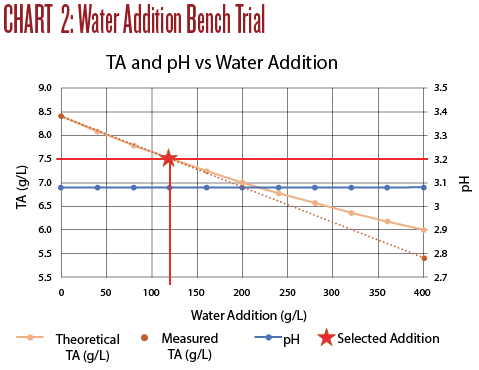
For the water dilution bench trial I titrated 20 mL of distilled water into 50 mL of Sauv Blanc while tracking the pH. The theoretical drop in TA is easy to calculate, since it should be proportional to the amount of water added. The TA actually dropped 0.6 g/L more than expected, to 5.4 g/L.
The pH however did not change over the entire titration. This surprising result is correct. pH is measured on a logarithmic scale. It would take a 10 times dilution to move the pH just 1 point, for example from 3.0 to 4.0. Adding 20 mL of water was not enough to move the pH noticeably.
Table 2 shows the effect of the water dilution on the pH and TA.
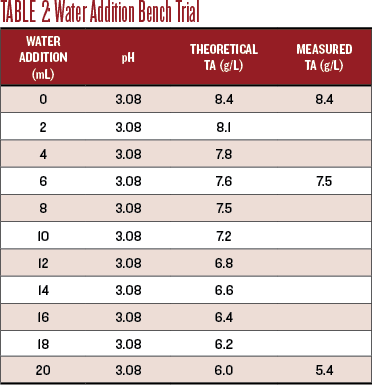
For sensory evaluation, I chose to evaluate the wine at the theoretical TA of 7.5 g/L and at the endpoint, TA of 6.0 g/L. The diluted wine at TA 7.5 g/L was not improved. The flavors were diminished while the effect of the still low pH was amplified. At a TA of 6.0, the wine was undrinkably thin, still acidic, and just yucky.
Titration results are shown in Chart 2. An addition of 120 mL of water to 1 liter of wine produced a TA of 7.5, with no measurable effect on the pH. While the water dilution did drop the TA it did not improve the taste at all.
A few observations from Trial 2:
• Small dilutions with water do not measurably change the pH, but do decrease TA.
• The TA dropped more than calculated.
• Dilution with water was far less effective than neutralizing with potassium carbonate.
Trial 3: Blending with high-pH wine
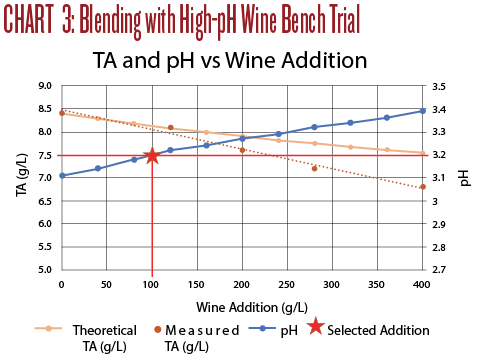
For blending, the only high-pH wine I had on hand was a barrel-fermented Marsanne/Rousanne (M/R) field blend with a pH of 3.99 and a TA of 5.4 g/L. The M/R had undergone malolactic fermentation. The blending did move the pH and TA towards the desired range but the M/R flavors overwhelmed the Sauv Blanc character, even at fairly low percentage additions. The wines were too stylistically different to make a harmonious blend. However, in low concentrations, the addition of the M/R rounded the acidity of the Sauv Blanc and made a drinkable wine — just one with no identifiable varietal character. It was just a white blend.
For this trial, up to 20 mL of M/R was titrated into 50 mL of Sauv Blanc, and the pH and TA were recorded after every 2 mL addition. Table 3 below shows the effect of the blend on the pH and the TA.
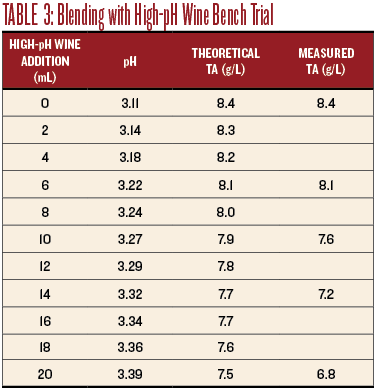
For sensory evaluation, I chose three points starting at the target pH of 3.22, corresponding to an addition of 6 mL, pH 3.27, corresponding to an addition of 10 mL, and 3.32, corresponding to an addition of 14 mL. The smallest addition was the best tasting, with the low pH acid bite rounded by the M/R. The Sauv Blanc character was prominent, but the wine was obviously a blend. At the 10 mL addition the blend was even more rounded, but the Sauv Blanc character was much more diminished, and the blend tasted like a jug wine with no distinguishable varietal character.
The titration results are shown in Chart 3. An addition of 100 mL M/R per liter of Sauv Blanc raised the pH to 3.2 but the TA remained high at 8.1 g/L. The taste was still tart, but the wine was more balanced. The oak and ML character of the M/R breaks through even at this low percentage addition and disrupted the Sauv Blanc character of the wine. Even though this wine was drinkable, it was not the intended Sauvignon Blanc.
A few observations from Trial 3:
• First, make sure the blend will achieve your flavor goals. These two wines clashed stylistically, and the end result, while drinkable, was quite unremarkable, even at only 10% Marsanne/Rousanne.
• More traditional blends like Sémillon and Chardonnay might work better together.
• Large additions of blending wine are required to appreciably move the TA and PH because the blending wine also has these components.
• Interactions between two wines are more complex and can be harder to predict because of the unknown acids and buffering capacity of each constituent wine. TA decreased dramatically more than the theoretical amount as greater amounts of wine were added.
• When blending, the sensory evaluation is more important than the numbers. While the goal of raising the pH to 3.2 was achieved, the wine was still mediocre.
Trial 4: Malolactic Fermentation
Every year, I make some of my Sauvignon Blanc as a “Fume Blanc” by putting it through MLF and aging it with some oak. I evaluated the effect that MLF had on the TA and pH of the wine.
It is commonly stated in winemaking circles that malolactic fermentation reduces the acidity of the wine. In this case, the TA did drop from 8.4 to 7.6, a change of 0.8 g/L. However, the pH was unchanged at 3.08 and the wine tasted as sour as ever.
Because there are no additions to be made to this wine, there was no titration and no charts.
A few observations from Trial 4:
• The pH of the wine was unchanged by ML.
• The TA decreased 0.8 g/L.
Conclusions
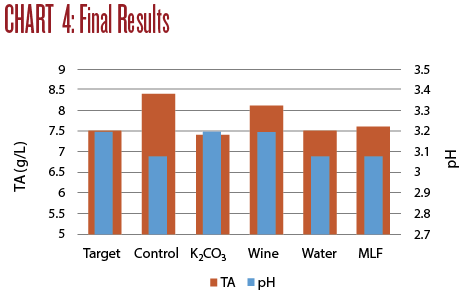
Of the four wine adjustments, only Trial 1 (the addition of potassium carbonate to deacidify the wine) brought both the TA and pH into the desired range of TA 7.5 and pH 3.2. Trial 3 (blending with wine) brought the pH into the right range, but the TA remained quite high. Trial 2 (blending with water) and Trial 4 (putting the wine through MLF) both brought the TA in line but the low pH was not improved.
Any one of these approaches may help correct a wine depending on the changes desired. The particular wine that needs improvement will play a role in the decision a winemaker will make. An overview of these four trials is illustrated in Chart 4.
None of the adjusted wines measures up to the previous Sauvignon Blanc wines I have made from this same vineyard. The quality of the grapes is the biggest determinant in the potential quality of the wine. While these approaches may still salvage this batch, it is much preferable to start with fruit that can be gently guided through the winemaking process.
However, sometimes the fruit is less than perfect and you don’t have control over it. Using bench trials to understand the effects of an adjustment on the wine chemistry and on the sensory perception of the wine can help guide the winemaker’s decisions in helping bring the wine back to its highest potential.
How to Conduct a Bench Trial for Acid Reduction with Potassium Carbonate
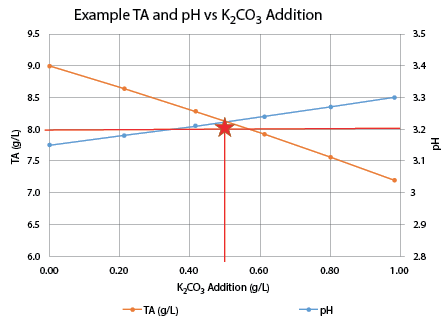
Because changes in TA and pH are related and relatively linear over the range of 2 or 3 g/L change, pH can be used as a proxy to estimate the TA, reducing the number of iterations required to dial in the acid adjustment. This technique can be used for acid additions as well as acid reductions. The end result is data that shows how the wine will respond to the entire range of additions, and allows the winemaker to pick the most promising adjustments for further sensory evaluation.
For a wine with a known TA and pH, the adjustment is incrementally titrated in and the pH is recorded after each incremental addition. The TA of the wine at the end of the titration is also measured and can be interpolated to show how the wine responded after each addition. For each incremental addition, the results show the amount of chemical added, the pH of the wine, and the TA of the wine. This data allows the winemaker to select the most promising additions for further sensory evaluation.
Example:
This is a sample laboratory procedure for running an acid reduction bench trial. Assume a white wine with a TA of 9.2 and pH of 3.15. The desired TA is 8 and pH of 3.2. For ease of calculation, use a 100 mL wine sample and 10 mL of titrant containing the desired chemical addition.
Desired Reduction in TA:
9.2 g/L – 8.0 g/L = 1.2 g/L reduction
The titration should overrun the desired endpoint TA to account for deviations in the “rule of thumb.” I use a multiplier of 1.5.
Target Change in TA:
1.2 g/L x 1.5 = 1.8 g/L target reduction
Rule of thumb acid reduction for potassium carbonate (K2CO3) is 0.6 g/L addition reduces TA by 1 g/L and raises pH by 0.25 units.
K2CO3 addition for 1.8 g/L TA reduction:
1.8 g/L x 0.6 g/L K2CO3= 1.08 g/L K2CO3addition
So with a 10-mL titration, we want to reduce the TA of 100 mL of wine by 1.08 g/L. We must reduce the K2CO3 added to match our sample size of 100 mL.
Adjust to the bench trial sample size of 100 mL:
100 mL / 1,000 mL x 1.08 = 0.108 g K2CO3
Now make the titrant containing 0.108 g of K2CO3 in 10 mL of wine. I suggest making 100 mL of solution so that the same solution can be used for the follow-on sensory evaluations. When making acid adjustments, always dissolve the chemicals in wine, not water. To deliver the desired 0.108 g/10 mL in the titrant, an additional 0.108 g must be added to account for the acid reduction in this wine.
For 100 mL of titrant:
0.108 g / 10 mL wine x (10 mL / 100 mL) = 1.08 g K2CO3
To adjust the titrant wine:
1.08 g/L x (100 mL / 1,000 mL) = 0.108 g K2CO3
Total addition to 100 mL of wine for titrant:
1.188 g K2CO3
To conduct the bench trial, pour 100 mL of wine into a beaker and place it on a stir plate. Calibrate the pH meter and position the probe in the wine. Draw up 10 mL of the titrant in a syringe. Add the titrant 2 mL at a time. Allow the pH to stabilize and record it after each addition. After the 10 mL have been added, test and record the TA of the adjusted wine. The change in TA can be interpolated to approximate the TA at each step of the titration. The results show how the wine responded to each step of the titration. I find that plotting the results shows the desired characteristics very clearly. Use the data to select the TA and pH that are closest to your desired objectives for the wine and reblend samples for sensory evaluation.